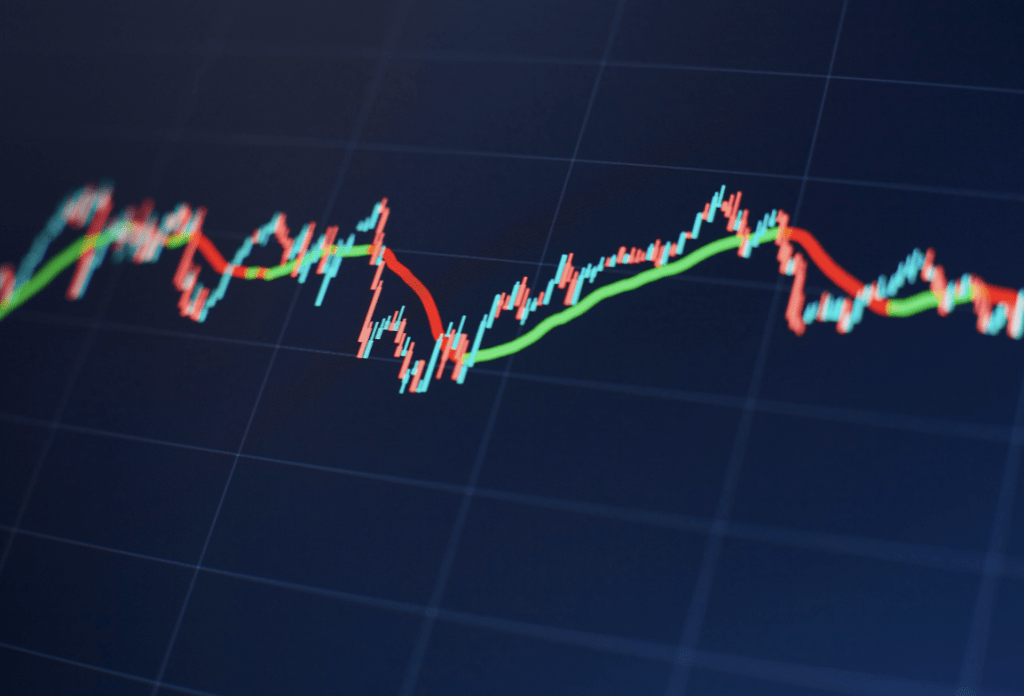
Would you like to begin trading but are not sure where to start? We have compiled a list of the most effective price action trading strategies for you. Price action refers to trading on a stock or other security based on its price movements. It is helpful to beginner traders who would like to concentrate on real-time information rather than being swayed by complicated indicators.
Let’s dive into the best strategies that can help you understand and master price action trading.
What is Price Action Trading?
Price action trading strategy involves the analysis of historical price movements to make trading decisions, and it is based on the idea that past rates of exchange can provide information about future rates of exchange.
Price action traders interpret market conditions using techniques such as candlestick patterns, support and resistance levels, and trend lines. You can also enroll in a price action trading course from Upsurge.club to deepen your understanding.
Key features:
- Charts: Most traders usually employ candlestick charts to study the changes in prices over time.
- Market Sentiment: Understanding how market participants react to price changes helps traders anticipate future movements.
- Simplicity: Avoiding complicated indicators, price action trading only uses prices as its information source.
In general, this approach is an easy one that emphasizes real-time data and market behavior thus it can be easily understood by starters in multiple markets over diverse periods.

Top Price Action Trading Strategies
Here are some top price action trading strategies:
Support and Resistance
Support and resistance are important levels on a chart where the price tends to reverse or consolidate. Support is a price level where buying interest is so strong that it can overcome selling and stop the price from falling further down.
On the other hand, resistance refers to a level where selling interest is enough to halt an upward-moving price. For traders, these are points that they look for in order to know when to enter and exit their positions.
When it is approaching support, it might bounce back up; if it breaks through, it will continue dropping. Conversely, when resistance breaks, its prices will rise further.


Trend Lines
Trend lines are straight lines drawn on a chart to connect the highs or lows of price movements, helping traders identify the market’s direction.
When in an uptrend, this line connects rising lows, indicating that buyers dominate. If it is in a downtrend, there will be falling highs and selling taking charge.
Traders use these lines to spot potential entry and exit points. For example, if the price bounces off an upward trend line, it may signal a good time to buy.
Conversely, if it hits a downward trend line, it might indicate a good time to sell.


Candlestick Patterns
Candlestick patterns are visual indicators on price charts that help traders identify potential market reversals or continuations. Key patterns include pin bars, which suggest a strong rejection of price levels, and engulfing patterns, indicating a shift in momentum.
Dojis, where the opening and closing prices are nearly the same, signal indecision.
By identifying these patterns, traders can make informed choices about when to enter or exit trades, anticipating potential market movements.


Breakout Trading
Breakout trading occurs when a trade is initiated as the price surpasses established support or resistance levels When the price breaks above resistance, it signals strong buying interest, while a break below support indicates selling pressure.
Traders look for increased volume during these moves, as it confirms the strength of the breakout.
Successful breakouts can lead to significant price movement, making this strategy popular among traders seeking to capitalize on momentum. Always utilize stop-loss orders to control risk.


Price Action with Moving Averages
Using price action with moving averages involves looking at how the price interacts with moving averages (like the 50 or 200-day).
When the price is above a moving average, it suggests an uptrend, while being below indicates a downtrend. Traders use moving averages to confirm trends and filter trade signals.
For example, if the price bounces off a moving average in an uptrend, it can be a good entry point for a long trade.


Conclusion
Learning price action trading can greatly improve your trading skills. It helps you predict the pricing movements of a security. As you get comfortable, you can also learn option trading and price action for derivatives from various courses offered by Upsurge.club.
WE SAID THIS: Don’t Miss…


